New Nasdaq-100 Index Strategies
To help you optimize your properly structured, maximum-funded Indexed Universal Life policy (what we call an IUL LASER Fund), it’s important to be aware of index strategies that can help you make the most of your opportunity for growth. To do that, let’s take a look at all-new index strategies that recently debuted.
As you look ahead to saving serious money for everything from real estate to retirement, what if you could tap into the growth of companies like Nvidia, Costco, Apple, Microsoft, and Amazon — some of the world’s most innovative large cap companies listed on the Nasdaq Stock Market?
If you’re considering opening a new properly structured, maximum-funded Indexed Universal Life policy (what we call an IUL LASER Fund), then you might want to look into a Nationwide policy that gives you access to exciting new index strategies:
- 1-Year Nasdaq-100 Point-to-Point Uncapped
- 2-Year Nasdaq-100 Point-to-Point Uncapped
- 1-Year Nasdaq-100 Monthly Average
While carriers have offered the opportunity to link to the Nasdaq before, these index strategies provide all-new ways to participate in this index.
Point-to-Point vs. Monthly Average
To help explain how these strategies work, let’s look at an illustration.
Most people are familiar with point-to-point strategies, where your index maturation is tied to a specific month from one year to the next (or to the next two years if you choose a two-year point-to-point, or to the next five years if you go with a five-year point-to-point).
Nationwide’s Nasdaq monthly average index, on the other hand, looks at the index every month for a 12-month maturation period and averages that rate of change. This helps smooth out any potential volatility throughout the year.
So let’s imagine these Nationwide index strategies had been available last year.
And let’s say you put $100,000 into your IUL LASER Fund in January 2025. You allocated $50,000 to the 1-Year Nasdaq-100 Point-to-Point Uncapped index (which has a 0% floor, a 100% participation rate, and a 10.75% spread).
Then you put the other $50,000 in the 1-Year Nasdaq-100 Monthly Average index (with a 0% floor, a 100% participation rate, and a 15.5% cap).
Based on actual performance, from January 2025 to January 2026, the Nasdaq earned 20.29%. That means your $50,000 allocated to the point-to-point uncapped index would be multiplied by 20.29%, minus the 10.75% spread, yielding a credit of 9.54%, or about $4,750.
With the $50,000 you allocated to the monthly average index, the average monthly rate for that same 12-month period was 7.86% (due to issues like tariffs and wars sparking market volatility). So that $50,000 would have increased by nearly $4,000.
Diversification Is the Key
Now this comparison might make someone think, “Why wouldn’t you always go with the point-to-point uncapped if it can yield higher returns?”
But keep in mind, that’s just how this particular point-to-point period worked out for the index.
What if the market had been going up from January through December, but it dropped in January, right before the maturity date — causing the point-to-point uncapped index change to be less than 10%?
Your $50,000 allocated to the point-to-point uncapped index with a 10.75% spread would have earned 0%.
And on the other hand, let’s say the monthly average index in that 12-month period saw a 5% gain. Your $50,000 would have grown by $2,500. In this situation, you would have come out ahead with the monthly average index.
This is why we often recommend diversifying your index strategy allocations. Since no one has a crystal ball to accurately predict what the market will do, diversification allows you to benefit from the advantages (and offset the limitations) of different index strategies.
A Closer Look at the Nasdaq Strategies
To explore what the new Nationwide Nasdaq index strategies could be capable of, let’s review some historical lookbacks.
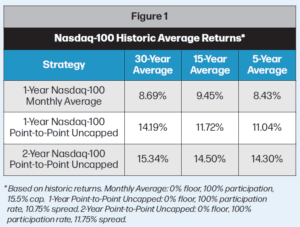
In Figure 1, you can see what the rates of return would have been for each of Nationwide’s Nasdaq-100 index strategies over the last 30 years, 15 years, and five years. (Note: By way of comparison, they would have been higher than many other index strategies on the market during those same time periods.)
Now what if we focus on just one of the index strategies — the 1-Year Nasdaq-100 Point-to-Point Uncapped? Figure 2 shows what the index’s annual returns would have been from January to January over the last 25 years.
In a few of the up years, the index strategy would have been credited as much as over 30% and 40%. And when market activity was negative, you would have been protected with the 0% floor.

Currently these new Nasdaq indexes are only available for new Nationwide policies, but they may potentially be rolled out to existing Nationwide policies down the road.
So if you’re looking to open a new IUL LASER Fund, these index strategies might be something you want to consider.
* Recommendations are not guarantees of future performance. Index Insights provided by LASER Financial.
_____________________________
Watch Aaron Andrew explain these concepts in more detail…
Video Transcription
Hi. This is Aaron Andrew with Three Dimensional Wealth and Laser Financial. And what I’m gonna talk about today is we are gonna look at the in the magazine, we’re gonna look at index insights. This is one of my favorite parts of, the magazine this month. So looking at it, and as you can see, I’m kinda looking here at, different pages here as I kinda glance at this. But index insights, this is page thirty four, yeah, thirty four and thirty five of the magazine of the spring twenty twenty six edition. So in this, I wanted to add this into the into the magazine this month because of these new Nasdaq indexes that came out with Nationwide. So Nationwide and a lot of people always ask, like, you guys always have the S and P, we want some other index accounts, and Nasdaq would be awesome. So Nationwide did. They came out with the Nasdaq one hundred index, and they came out with some very cool strategies. Because a lot of companies, they have a floor and a cap, which is great, like the S and P, a floor of zero cap of ten and a half. That’s great. But I love the uncapped accounts, and they came out with the Nasdaq with an uncapped. You need to realize that a lot of these accounts have caps or spreads because of the cost of the options and the hedging to guarantee you a zero. And to get this kind of stuff, you’ve gotta have these different features in there when they’re running the hedging and the option strategy. So with the Nasdaq, they came out with three. K. So if you look at these pages, what we’re gonna talk about is the Nasdaq monthly average. So again, if it’s point to point, that is what is the market today, what’s the market a year from now, usually those have a cap of around ten percent right now, ten ten and a half with the S and P. What they did with the Nasdaq one hundred monthly, they came out with a monthly average strategy. So instead of point to point, because that would have a cap around nine or ten percent, they came up with a monthly average strategy. What that does is it helps us capture more gains in the Nasdaq by looking at the index every month. So what’s the index this month, next month, next month, all twelve months. So the next twelve months, what’s the Nasdaq? And they’re gonna average it for the year. K. Divide it back into the original, you know, starting point. So you’re gonna look at the the growth of Nasdaq average. So it kinda smooths out the volatility. It’s pretty cool. But because of that, sometimes the return’s a little bit smaller than the point to point. But a lot of times, if the Nasdaq goes up a lot, you’re gonna be able to hit that cap of fifteen and a half percent. Whereas if they just did point to point, it’d be lower. That’s a lot to absorb. Bottom line is the cap is fifteen and a half percent on this monthly average. Many times the last ten years, we would have averaged, you know, that kind of return. Actually, let’s look at that. On page thirty thirty six over there sorry. I’m kinda moving around my camera here. Let’s go let me back out of this again here and look at yeah. Page thirty five, excuse not thirty six, page thirty five. So if you look at that page, thirty five there on the right, on the right side of the that, you know, page, you can see the Nasdaq monthly average last five years would have been eight point four three. Last fifteen years, nine point four five. Last thirty years, eight point six nine. Those are pretty good returns when all we can illustrate right now is six point five nine percent on an illustration. Those are great solid returns where we can earn as high as fifteen and a half, guarantee of zero on the bad years, no risk of losing, and yeah, those are great returns. Now, the next two I wanna really talk about are my more favorite accounts, the uncapped Nasdaq accounts. So the one year Nasdaq one hundred point to point uncapped, that one has a spread of ten point seven five. So if the market goes up, let’s just say, know, you can even look at well, I I we show some examples in here. But let’s just say the market goes up. Let’s use an example of well, right now, today. I’m gonna look at today at the time of this recording. Let’s just do it live right now. So the market right now, the Nasdaq right now today, at the time of this recording, is up thirty eight and a half percent. So we take thirty eight and a half percent. That’s a huge gain in the Nasdaq one hundred over one year. Now we gotta subtract the spread of ten point seven five. So you get all the growth of the Nasdaq minus ten point seven five, the spread. So your return, of course, is gonna be twenty seven point seven five. So that’s what we would be getting right now today over one year tax free with no risk. If the market was negative, we get zero. So the market’s only up five or ten percent. We’re gonna get zero on that Nasdaq one hundred. But take a look at those averages there. Sorry. I’m moving around my phone. Doing this quick recording here. Is look at the averages there on that page thirty five. The last five years, app already taken the spread out, but you don’t lose them the bad years. This is why it’s so high still. Is the last five years, you would average eleven point zero four. K? Look at the middle one there. The fifteen year, eleven point seven two. The thirty year, fourteen point one nine. Just awesome high high returns on that uncapped Nasdaq. Now, again, the S and P only has a spread, right now of five and a half percent. So the S and P sounds better, but the S and P returns are slightly lower than this because the S and P is doesn’t hasn’t gone up as much as the Nasdaq on a lot of those big years. Okay? So look at the next one down. Look at the two year Nasdaq. Now, I have some clients going a hundred percent in that one right now. Now, I like to diversify usually, so it’s up to you as a client though. But that two year Nasdaq is you get all the growth, k, all the growth of the Nasdaq over two years. What was it? Two years ago or when you start. What is it? Two years later. All that growth of the Nasdaq minus eleven point seven five. So one per one percent higher on the spread, you gotta realize that’s over a two year basis. So that’s the equivalent of taking six percent off the top. So on these averages historically, look at the last five years. Fourteen point three. That’s the annualized return. So that’s the annual return after the spread, what you would have averaged the last five years. Fourteen percent tax free with no risk. Really cool. Look at the fifteen year, fourteen point five. Look at the thirty year, fifteen point three four. Incredible average returns on that two year Nasdaq. We’re only running these at six and a half. K? So these new Nasdaq accounts are super exciting, super great. Now these spreads, of course, can change. They can go up. They can go down. But this is what the averages would have been had you had these index accounts with these spreads over this, you know, over that historical five, you know, fifteen and thirty year, you know, scenarios. K? So, also, over on the right, take a look at the very far right side of that page, on page thirty five. This shows you year by year what your returns would have been. You can see that it was really bad in the early two thousands. So you gotta be patient and be you know, understand the risks of this account too, that you don’t get any returns until the Nasdaq has gone up above ten point seven five. So look at those zero years in those early years. You got a thirty two percent, you know, in two thousand and four. Because those returns, you can see the index returns, then you minus the ten point seven five, you see what your return is on the far right column, you know, right there on that page thirty five that I’m showing you. K? So you look at those average returns there, you can see that even this last year, k, that was January, by the way. That’s I was giving you guys a date of today, like in May. But right there at the bottom of that, you know, bottom right hand corner of that page kind of, that nine and a half is using a January date, January fifteenth. So every date’s gonna be a little different. So you can also put in monthly to kinda diversify. But these index accounts are super exciting. K? Make sure you call us up, talk to your IOL specialist, and we can help you, understand, you know, these accounts a little bit more and how they might work. And these are available in the brand new nationwide policy. Anybody that has a nationwide policy from a few in the last few years, they’re looking to add these index accounts to your policy, probably about a year from now. Maybe first, second quarter of twenty twenty seven. So that’s exciting, but all new clients are getting access to these Nasdaq accounts, these three different accounts. So there’s three great SMB accounts. These are the three Nasdaq accounts that we have been super excited about that they added. So thanks for watching. Hopefully, that was fun. Just talking through it, helping you guys understand indexing using the Nasdaq one hundred. Take care.
Click here to see magazine pg. 34 -35 that Aaron is referencing.
_____________________________

Your next annual review is a perfect time to make changes with your index strategy allocations. Talk to your Certified IUL Professional about strategies that interest you! Just scan the QR code or click here.
Want to see actual Nasdaq-100 index strategy results? Check out our Spring 2026 “IUL Performance Watch” article today.