IUL PERFORMANCE WATCH
To help you stay abreast of market conditions, here we provide a snapshot of trending indexes, as well as a resource to monitor your individual IUL performance.
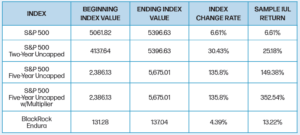
Index Details:
- S&P 500 one-year point-to-point with a participation rate of 100% and a cap of 10%. Maturity Date: 4/15/25.
- S&P 500 two-year uncapped point-to-point with a 5.25% spread, a participation rate of 100%, and no cap. Maturity Date: 4/15/25.
- S&P 500 five-year uncapped point-to-point, a participation rate of 110%, and no cap. Maturity Date: 3/15/25.
- S&P 500 five-year uncapped point-to-point, a participation rate of 110%, no cap, with a multiplier of 2.36. Net return after multiplier fee: 315.04%. Maturity Date: 3/15/25.
- BlackRock Endura (available through Pacific Life) one-year point-to-point with a participation rate of 200%, no cap, and an additional multiplier of 2.36 times (for an extra cost of 7.5%). Maturity Date: 3/15/25.
How Is YOUR IUL LASER Fund Performing?
Curious about your policy’s recent performance?
You can check it out by accessing our free IUL Performance Calculator, an online tool we’ve created to help you stay on top of things.
Step 1 – Click here to go to the IUL Performance Calculator.
Step 2 – On the calculator, enter your information, answering simple questions like: Does your index have a cap? What’s your index participation rate? What are your beginning and ending index segment dates?
Step 3 – Get a quick snapshot of your own IUL LASER Fund performance!
Step 4 – While you’re there, you can also scroll down to see examples of actual recent returns on other available indexes (like the one below)! This can give you an idea of index strategies you might want to discuss with your Certified IUL Professional when your current segments come up for maturity.
*Samples are not guarantees of future performance. IUL Performance Watch provided by LASER Financial.
………………………………………….
INDEX INSIGHTS
To help you optimize your IUL LASER Fund, it’s important to stay abreast of index strategy choices, especially in light of current market conditions. To do that, let’s take a closer look at a few of the indexes highlighted in the “IUL Performance Watch.”
Why Use a Multi-Year Strategy?
When weighing index strategy choices for your properly structured, maximum-funded Indexed Universal Life policy (what we call an IUL LASER Fund), you may want to consider a multi-year strategy.
You’ll notice on pg. 26 that we included returns for a few multi-year strategies. Each of the multi-year indexes featured is uncapped, meaning there’s no limit on the rate of return — whatever the market does in that period, you would get the full gain (and if the market drops, you’re protected with a 0% floor). Here are some differences between the strategies:
- With the two-year uncapped index, to cover the insurance company’s risk, there’s a threshold/spread of 5.25%. So with the two-year period’s 30.43% gross return, the net return was 25.18%.
- With the five-year uncapped indexes, the longer time period minimizes the risk to the carrier, so in this case, the carrier doesn’t charge a threshold/spread.
- The five-year strategy with a 110% participation rate gave a 10% boost to the 135.8% gross return, yielding a net return of 149.38%.
- The five-year strategy with a 110% participation rate and a multiplier of 2.36 saw even bigger gains, with a 352.54% return. Keep in mind, multipliers come with a fee, so the net return for this index was 315.04%.
Since IUL LASER Funds are long-term vehicles, a five-year index strategy can be extremely attractive. It’s important to remember, however, that it’s best to leave any money allocated to a multi-year index alone during its maturity period.
In other words, you want to avoid borrowing against that money, as doing so removes it from the index, and you immediately forfeit any gains for that segment.
This is why we recommend diversifying your index strategies, so you have a mix of one-year and multi-year strategies.
Policyholders who don’t anticipate accessing much from their policy in the near future (for things like tax-free income or working capital) may want to allocate as much as 60% to 75% in a five-year strategy.
On the other hand, policyholders who are likely to borrow against their policy (for tax-free working capital, retirement income, or other needs) may want to put more of their money in one-year indexes.
And remember, some carriers offer multipliers, which can be especially beneficial in an up market. However, if the market drops, you’ll be protected by a 0% floor but still incur the multiplier fee.
Why Use a One-Year Strategy?
Despite the advantages of multi-year strategies, one-year strategies have their benefits, as well. In fact, many of our clients allocate a good portion of their policies to one-year strategies (ranging from capped to uncapped, with and without multipliers).
We have one client, for example, who stuck with one-year indexes over the last six years, but changed up the specific type of one-year strategies, moving from no cap, to high par, to capped, etc. — all based on what was currently happening in the market. Over the last six years? He saw a cumulative gain of $1.3 million.
As you can see, your index strategy choices can have a significant impact on your policy performance. As with all things IUL, be sure to consult with your Certified IUL Professional for guidance in making any desired changes when your current segments come up for maturity.
*Recommendations are not guarantees of future performance. Index Insights provided by LASER Financial.
 > Your next annual review is a perfect time to make changes with your index strategy allocations. Click here to talk one of our Certified IUL Professionals about indexes that interest you.


!['tis the [tax] season](https://3dimensionalwealth.com/wp-content/uploads/2025/09/3DW-Blog-Tax-Season.png)