IUL PERFORMANCE WATCH
To help you stay abreast of market conditions and index strategies for tax-free retirement, here we provide a snapshot of trending indexes, as well as a resource to monitor your individual IUL performance.
Index Details:
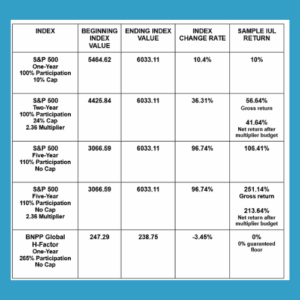
- S&P 500 one-year point-to-point with a participation rate of 100% and a cap of 10%. Maturity Date: 6/16/25.
- S&P 500 two-year point-to-point, a participation rate of 100%, a 24% cap, and a multiplier of 2.36 with a multiplier options budget of 7.5% per year (15% total multiplier options budget over two years). Maturity Date: 6/16/25.
- S&P 500 five-year point-to-point, a participation rate of 110%, and no cap. Maturity Date: 6/16/25.
- S&P 500 five-year point-to-point, a participation rate of 110%, no cap, and a multiplier of 2.36 with a multiplier options budget of 7.5% per year (37.5% total multiplier options budget over five years). Maturity Date: 6/16/25.
- BNPP Global H-Factor one-year point-to-point with a participation rate of 265% and no cap. Maturity Date: 6/17/25
HOW IS YOUR IUL LASER FUND PERFORMING?
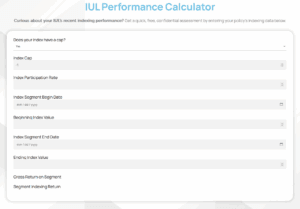
Check out your own policy’s performance with the free, confidential IUL Performance Calculator.
Curious about your policy’s recent performance?
You can check it out by accessing our free IUL Performance Calculator, an online tool we’ve created to help you stay on top of things.
Step 1 – Click here to go to the IUL Performance Calculator.
Step 2 – On the calculator, enter your information, answering simple questions like: Does your index have a cap? What’s your index participation rate? What are your beginning and ending index segment dates?
Step 3 – Get a quick snapshot of your own IUL LASER Fund performance!
Step 4 – While you’re there, you can also scroll down to see examples of actual recent returns on other available indexes (like the one below)! This can give you an idea of index strategies you might want to discuss with your Certified IUL Professional when your current segments come up for maturity.
*Samples are not guarantees of future performance. IUL Performance Watch provided by LASER Financial.
………………………………………….
INDEX INSIGHTS
To help you optimize your IUL LASER Fund, it’s important to stay abreast of index strategy choices, especially in light of current market conditions. To do that, let’s take a closer look at a few of the indexes highlighted in the “IUL Performance Watch.”
MARKET TURMOIL — WHAT TO DO?
So far, 2025 has seen some notable market swings. From tariff negotiations to global conflicts and natural disasters, the market has responded with plenty of ups and downs.
In times of persistent market volatility, you might be wondering which index strategies are best for your properly structured, maximum-funded Indexed Universal Life (what we call an IUL LASER Fund).
In the IUL Performance Watch above, we break down some of the more in-demand indexes. And while past performance isn’t a guarantee of future performance, it can help to look at recent results to guide your index choices during your next annual review.
S&P 500 ONE-YEAR VS. TWO-YEAR
At the top of the table, you can see the S&P 500 one-year with 100% participation and a 10% cap increased just over 10%, so policies using that strategy saw their cash value increase by 10% during that maturity period.
The S&P 500 two-year with 100% participation and a 24% cap performed very well over the previous two years (just over 36%), so policies with this strategy saw a 24% increase during that period. Policyholders who also opted for a 2.36 multiplier on this index saw even higher gains, with a net return of 41.64%.
S&P 500 FIVE-YEAR
As we look at the five-year accounts, the S&P 500 five-year with 110% participation and no cap did extremely well, yielding a 106% return. And those who chose the same index with a 2.36 multiplier saw significant net gains of over 213%.
COMPARING STRATEGIES
You likely noticed one of the advantages of the five-year strategies: They don’t have a cap. How is this possible?
These longer-term index strategies are less expensive for the insurance company, so they can waive the cap. When comparing the five-year strategy with a 106% return versus the one-year with a 10% cap, it might seem like a no-brainer to always choose a five-year strategy.
But it’s not that simple. Because you only lock in your gains at the end of the maturity period, you might be fortunate, like those who locked in gains of 106% during this particular five-year period.
But what if during your five-year maturity period, the S&P 500 had seen three up years, followed by two down years, and your index strategy showed a net loss? You would have yielded a 0% return for the entire five-year period.
If, on the other hand, your money were in the one-year, you would have locked in gains during those first three positive years, and then been protected by a 0% floor during the last two. The one-year would have yielded better results in that five-year time period.
Now let’s look at the benefits of adding a multiplier, which can supercharge your returns. You can see for the two-year strategy with a 2.36 multiplier, you would have seen a net return of 41.64%. And with the five-year strategy with a 2.36 multiplier, you would have gained a net 213% during that maturity period.
But keep in mind, multipliers require an options budget to cover the risk. If the returns had been negative during your maturity period, you would be protected by the 0% floor, but you would still be charged the multiplier budget.
For the two-year multiplier, that would be 15% (two years multiplied by 7.5% per year), and for the five-year multiplier, you’d be charged 37.5% (five years multiplied by 7.5% per year). Not all carriers offer multipliers, so if you’re interested in multipliers, check with your Certified IUL Professional to understand your options.
VOLATILITY CONTROL INDEXES
Notice the BNPP Global-H Factor index with a 265% participation rate and no cap.
This is a good example of a volatility control index. VCIs move the amounts allocated to bonds, cash, and some conservative equities on a daily basis, and they’re designed to maintain a volatility of around 5%.
Because of that low volatility, the insurance companies can offer a participation rate that’s above 100%, along with no cap. There is a trade-off however — while in some years these accounts can gain more than the S&P 500, in others, they won’t perform as well.
Historically VCIs have yielded positive gains, but the last few years they’ve struggled — with the exception of the BNPP, which did very well last year. But as you can see in this recent maturity period, the BNPP was down, which means you wouldn’t have gained anything, however you would have been protected by the 0% floor.
With recent volatility and high short-term interest rates, VCIs aren’t likely to be your best choice, but they might be something to consider next year, when they could turn around.
As you look at the nuances of each type of index, you can see why we often encourage diversification with your indexing strategies, so all your eggs aren’t in any single basket.
You can also see why it’s helpful to attend your annual reviews and work closely with your Certified IUL Professional, as they can help you make choices with your index strategy allocations each year.
*Recommendations are not guarantees of future performance. Index Insights provided by LASER Financial.
 > Your next annual review is a perfect time to make changes with your index strategy allocations. Click here to talk one of our Certified IUL Professionals about indexes that interest you.